Welcome back to Riding Rails, this is Part 3. In this part, we’ll be working with GitHub Jobs and persisting the information in our database. We’ll see how far we get today. I think there will at least be four parts to this series. I’m coding this application live, and I’m trying to keep these parts from being too long.
If you’re just stumbling in, you probably missed Part 1 and Part 2. This builds on the other two parts, so you’ll probably want to hop back and read those first.
Recap
We left off last time learning about testing, fixtures, model validation and Guard for running our tests automatically.
Before we get started today, how did you go about solving the URL validation? There’s no real wrong answer. I guess if you skipped it that could be considered incorrect. Did you find the format validator and tried your hand at validation by regular expression? If you went this route, I hope you have a lot of tests. URL testing can be tricky. Hmm, if there were only other options. Did you happen to search the web for Rails URL validation? You may have stumbled on at least a couple of gems that solve this issue. The benefit of using a gem here would be that someone already did testing on it. Notice I didn’t say “maybe did testing,” because the Ruby community is awesome.
Yes, yes, I’m sure there are gems without tests/specs, but I can’t imagine them being very popular. In fact, read on.
You also could have written a custom validator. The would also require a lot of tests. My choice was to use the valid_url gem as it states it has “The highest test coverage with more than a hundred different valid and invalid URL examples.” That’s cool, have a look at the specs. Another option I quickly came across was validates_url. It’s similar to valid_url, and I’m sure just as good.
Gem or No Gem
The first thing we’ll do today is look at utilizing the github-jobs gem. If you inspect the code for the gem, you’ll find that it’s straightforward. It merely queries GitHub Jobs and puts the results into an OpenStruct. We need the results in the job_slayer jobs model, which we could fill pretty easily from an OpenStruct. After reviewing the specs that exist for the gem, it’s not worth using it, sadly. It won’t save us from testing at all because there are just a few specs in the gem. This is a good example of a non-popular one. I didn’t take the time back in Part 1 to review the gem, and it’s specs. No worries though, we can pivot from the initial plan without issue.
Jump Right In
Let’s get to work querying GitHub Jobs. We will test-drive this feature (remember TDD) and since we are using Guard, there is no need to run your tests manually.
Guard is still running, correct? If not, spin it up with the command guard. Make sure you are in your application’s root directory.
Let’s walk through a test or two and then I’ll give you the requirements before moving on to the actual code so that you can get familiar with writing tests yourself. The first thing we have to do is create a test file. Create a directory (parsers) under test and a new file github_jobs_test.rb. Full path should be test/parsers/github_jobs_test.rb. We’ll add in the GithubJobsTest class and our first test. Note also the require test_helper at the top.
require 'test_helper'

class GithubJobsTest < ActiveSupport::TestCase
  test "should have a class method of import" do
    assert_respond_to GithubJobs, :import
  end
end
In this basic test, we’re asserting that our class GithubJobs has a method (responds to) called import. We need to be able to call GithubJobs.import
You might be more familiar with the term static methods instead of class methods. Class methods in Ruby are “close” to static methods in say C#.
We now need to add the class and class method of import to make this test pass. Here’s the full class (this is a new file/directory that you need to add, app/parsers/github_jobs.rb):
class GithubJobs
  def self.import
  end
end
This is some new syntax here. By defining a method with self creates a class method. That is called like so: GithubJobs.import. There isn’t any reason to instantiate anything here since this is a “utility method.”
From import we want to get back an array of job models. But before we do, think about what we expect to get from not supplying any parameters to the method. Should we return all of GitHub Jobs’ jobs? It will limit the result to 50, so I guess it’s ok to do that, though I don’t see us using that feature. Perhaps we should require a parameter, something like a search term. Let’s do that and make sure the param is not empty. Add this to the GitHubJobsTest
test "should not work without the term param" do
  assert_raises(ArgumentError) { GithubJobs.import }
end
We’ll raise an error if the import method gets called without an argument. We’ll utilize Rails’ blank? method. The blank? method returns a boolean. In Ruby if a method returns a boolean, it typically is appended with a question mark. This isn’t a hard/fast rule; it’s at the option of the developer. But something to keep in mind for good practice as we’re developing.
def self.import(term)
  raise ArgumentError, 'You must supply a term' if term.blank?
end
Ruby is beautiful and expressive, so instead of using the block form of if we can put it after a method. Oh, you don’t need parentheses to call a method, so raise ArgumentError, 'You must supply a term' can also be written as raise(ArgumentError, 'You must supply a term'). Just as with the question mark appended to a boolean, this is up to the developer.
Getting Results
Now that we have our method set up, we’re going to start calling GitHub Jobs. This is a problem with testing. Imagine we write this test and it’s run 100 times, that’s 100 calls (for one test) to GitHub Jobs. We don’t want to do this to their service, so we need to think of a better option. We could mock the return from GitHub, but there is an easier way. Here is another gem that we’ll use in our project. It’s called vcr. We also need the gem webmock which will intercept web calls for us.
You remember how to install/use a gem in our tests, right? Add them to the group :development, :test like so:
group :development, :test do
  ...
  gem 'vcr'
  gem 'webmock'
end
Then run bundle install. Within the test_helper.rb file, add the following between require 'rails/test_help' and the class definition:
...
require 'vcr'

VCR.configure do |config|
  config.cassette_library_dir = "test/vcr_cassettes"
  config.hook_into :webmock
end
...
Don’t put your cassettes directory under test/fixtures, as Rails will try to load them for each test and error.
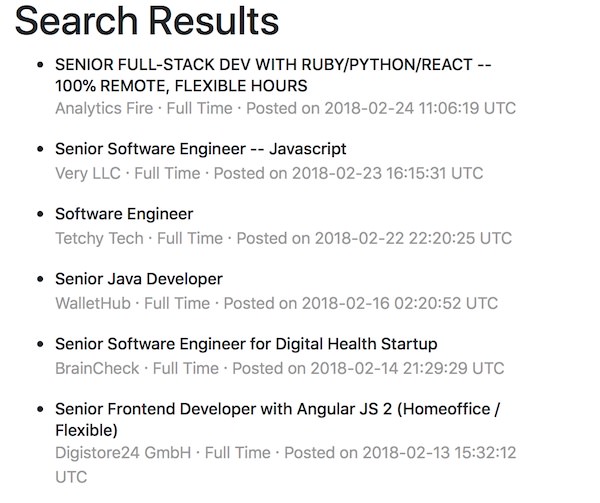
We have set up vcr, I’ll explain how it works later, now let’s use it in a test. We need to do one thing. First, we need to go out to GitHub Jobs’ site and find a term that has a couple of jobs available to test our method. Depending on when you do this, you will likely get different results from what’s listed here, but the concepts will all be the same. I searched for my favorite JavaScript framework, Ember.js, and that yielded just one job. I’ll use this for the example test.
The first thing to test is to make sure the method import returns an array.
test "should return an array" do
  VCR.use_cassette('search-ember') do
    results = GithubJobs.import 'Ember.js'
    assert_kind_of Array, results
  end
end
We can satisfy this with just the following:
def self.import(term)
  raise ArgumentError, 'You must supply a term' if term.blank?
  []
end
Tacky, huh? Oh, that probably looks weird if you are new to Ruby. That [] is an empty array, and because it’s the last line of the method, it’s returned automatically without you having to specify return. You can if you like, but other Rubyists may point and laugh at your code.
Anyway, that’s all we need for this test which now passes, let’s keep going. Add another test method as below and see if you can figure out how to make it pass on your own.
test "should return an array of job models" do
  VCR.use_cassette('search-ember') do
    results = GithubJobs.import 'Ember.js'
    assert_kind_of Job, results.first
  end
end
Did it pass? Fail? Are you confused? Did you change that last line in the import to be:
Kudos! Obviously, we need more tests. Oh, you’ve probably noticed the VCR.use_cassette('search-ember') block in the past two tests. This is all we need to do to use VCR. What will happen is once we make a web call, it will record it and file it for us. The second run of the test will make the same request to a URL, but VCR will intercept it and give us back the recorded records. Pretty sweet, eh? This gives us a snapshot of results that we can test against, and it will be constant regardless of what happens at GitHub Jobs.
Now, let’s keep testing! We need to make sure each property of the job is filled in. So we’ll add a test for each property. Remember, one assertion per test (thank you, Roy Osherove). I’m not going to copy all the tests here, but I’ll give you one to get you started:
  test "should fill in the job model's title" do
    VCR.use_cassette('search-ember') do
      results = GithubJobs.import 'Ember.js'
      assert_equal results.first.title, 'Javascript Application Engineer'
    end
  end
At this point, we need to actually query GitHub Jobs to satisfy the test. This is going to be super simple thanks to Ruby’s built-in JSON parser. We also are going to need the OpenURI library, which is part of Ruby, we just have to require it so Rails can tell which open we want (if you don’t do this, Rails will try to open the URL as a file, not what we want). Here is what app/parsers/github_jobs.rb should look like:
require 'open-uri'

class GithubJobs
  def self.import(term)
    raise ArgumentError, 'You must supply a term' if term.blank?

    params = "description=#{URI.encode(term)}"

    result = JSON.parse(open("https://jobs.github.com/positions.json?#{params}").read)
    result.map { |job| Job.new(job) }
  end
end
This will give you three UnknownAttributeError errors, because the job hash contains keys that Rails doesn’t know about, like url. Also, it’s going to have a problem with both id and created_at, because those get handled automatically, and we don’t want GitHub’s data in those fields, we want our own. Finally, we also need to set the other attributes to custom values, such as source and source_url. Because of this, Job.new won’t work for us.
We’ll fix this with a class method on job called build that will build a job model for us.
You may be thinking “why are we creating a job this way and not using the constructor?” It’s because overwriting initialize on ActiveRecord objects is a bad idea.
In app/parsers/github_jobs.rb, change the last line:
class GithubJobs
  def self.import(term)
    ...
    result.map { |job| Job.build(job) }
  end
end
Now create the class method on the job model:
class Job < ApplicationRecord
  ...

  def self.build(attributes)
    new do |j|
      j.title = attributes['title']
    end
  end
end
Make sure you use strings for the hash keys here instead of symbols. This is because JSON gives us string keys/values. Generally, in Ruby, you use symbols for hash keys.
Go ahead and add tests for each attribute of the job model, making sure it’s filled. Did you forget the names? Look back at Part 1. I’ll show you one more test:
test "should fill in the job model's posted_at date" do
  VCR.use_cassette('search-ember') do
    results = GithubJobs.import 'Ember.js'
    assert_equal results.first.posted_at, DateTime.new(2018, 2, 7, 3, 12, 1)
  end
end
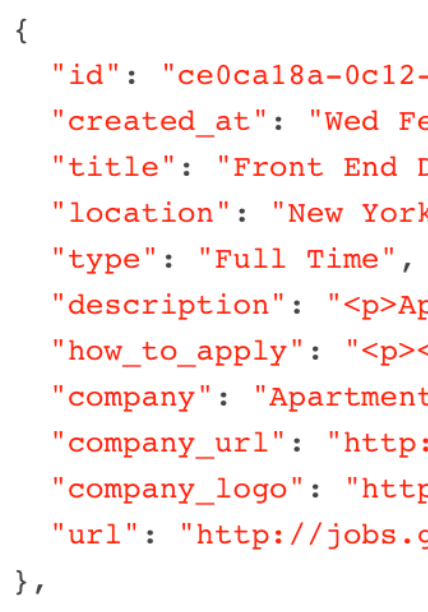
Remember, my data is probably different from yours, so make sure you look at the JSON result for the first job that comes back. You can access the JSON from GitHub Jobs by tacking on a .json to the end of the URL.
And the code to make it pass:
def self.build(attributes)
  new do |j|
    j.title = attributes['title']
    j.posted_at = attributes['created_at']
  end
end
Continue writing a test and then mapping each attribute from the hash to our new job object. When you finish, you should have 24 total tests and assertions. I know it’s tempting to skip tests, but it’s important to ensure that all our attributes have values. In Guard, you can run all your tests by just hitting Return in the Terminal that’s running Guard. You can also type all at the prompt, but that’s what the Return key does.
Rails Console
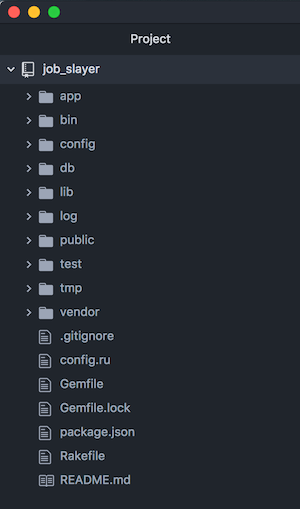
For our last topic today, let’s try out querying GitHub Jobs and saving the job model to the database. We don’t have time to build the interface as this tutorial is pretty long already. Instead, we’ll take a look at the Rails console. Open a new Terminal instance in the job_slayer directory and fire up the Rails console with the command rails c or rails console.
To start off, let’s try using the GithubJobs.import method, remember to give it a search term or you’ll get an ArgumentError. For example:
2.5.0 :002 > jobs = GithubJobs.import 'javascript'
 => [#<Job id: nil, title: "Senior Product Engineer"...
Now, if you want to persist the array returned from our parser, all we need to do is loop over each job and call the method save on it, you can do it like so:
jobs.each {|job| job.save!}
But with Ruby, we can shorten this code up:
This will iterate through the array and call save! on each job. Note that I’m using save! vs. just save. The one with the exclamation point will throw an exception if it fails, where save returns a boolean. When looping like this, it’s a good idea to use save!
The exclamation point is another convention that Rubyists use to denote that something is either going to modify the object directly or could potentially throw an exception. Again, it’s up to the developer. This is just like the question mark for boolean operations, like blank?.
To exit the Rails console, just type exit and hit Return.
Wrap Up
This tutorial went a little long today, but we learned valuable lessons. We discovered the VCR gem, which allows us to record our web interactions, and automatically play them back when we query again. We found that parsing JSON is a piece of cake with Ruby. We also saw how to test-drive a complete class using TDD.
In the next part of “Riding Rails,” we’ll put all this to work. We’ll work on a front-end for searching GitHub Jobs. This will entail routing, controllers, and views. Don’t worry though, it sounds like a lot, but it isn’t with Rails.
]]>