ASP.NET 3.5 Charting Control - Formatting Tooltips as Date
 I’m sure you all have heard that there is now a free ASP.NET charting control that is an add-on to ASP.NET 3.5. If you haven’t or need one of the bits, check out ScottGu’s blog. I recently started using the component and it’s really nice. While working with it, I ran into an issue formatting Date values in the tooltips, so I figured I would share my findings.
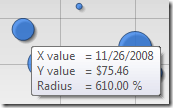
In order to format the tooltips, I needed to use one of the supported keywords in order to get the proper value (#VALX). I used an example from the samples as a guide when formatting my tooltip. The chart from the samples shows a chart like the one in the picture off to the left with the tooltip and multiple formatting. Based on the samples, I had the following code in my ASPX.
Note that this code is inline compared to in the code-behind in the sample, but that shouldn’t make a difference.
<asp:chart ...>
    <series>
        <asp:series name="SampleSeries" xvaluemember="Date" yvaluemember="Value"
            charttype="Line" tooltip="Date: #VALX{d}" />
    </series>
    ...
</asp:chart>
Looking at the tooltip, this should format the X Value to a short date, however when I ran the chart, my tooltip appeared as a number (as it’s represented internally by the charting component). From my example above, you can see the formatting syntax is fairly simple. It is just the keyword followed curly braces housing the format string. You can use any of the standard .NET format strings. For example, I could format the date like #VALX{MM/dd/yyyy} or if I have a currency for the Y Axis, I could use #VALY{C}.
As you may or may not know, the MS Chart control is based on the Dundas Chart source code 5.5 (more information on the differences here). With this knowledge, I did a bit of searching and came across this link on the Dundas support site, I finally came up with the solution to my date formatting problem. The solution is to set the xvaluetype property of the series. This wasn’t really obvious since I figured the formatting / type from the axis would carry over to the series, but it didn’t. Anyway, setting the xvaluetype to DateTime, caused the tooltip to format correctly. Unfortunately this wasn’t shown in the example code in the samples, but hopefully this post will save someone else some time if they encounter this issue. Here is the final series code, and it now works as expected:
<asp:chart ...>
    <series>
        <asp:series name="SampleSeries" xvaluemember="Date" yvaluemember="Value"
            charttype="Line" tooltip="Date: #VALX{d}" xvaluetype="DateTime" />
    </series>
    ...
</asp:chart>

Damien White Twitter
Hi, my name is Damien White. I'm a software architect with over 20 years of experience. I simply love coding! I have a driving passion for software development, and a thirst for knowledge that cannot be quenched. I enjoy writing Web and Mobile applications, and I'm happy to share what I know in my quest to learn as much as possible.